AIMBOT: Autonomous Air Hockey Robot
Throughout high school, I competed in FIRST Robotics, an international robotics league, and it sparked in me an interest in robotics.
It's the reason I eventually went into engineering and Computer Science.
I've always been interested in autonomy, computer vision, and robotics, and I thought building a robot to play air hockey would be the perfect challenge, and over summer, I decided to make it into a reality.
This entire project was designed, built, and programmed by me as a challenge to see whether I could build a robot to play air hockey against a human opponent.
I settled on a fairly simple design using two linear sliders moving in the x and y directions and assembled (and manufactored) the required components.
The hardware it employs is simply a phone to capture the live feed and two motors for motion as well as an Arduino to control them.
The real magic to the robot is the software that it applies.
I started by collecting 30 videos of my sister hitting the air hockey puck. To perform more advanced analysis, I wanted to normalize the videos so the puck's location in the frame would move linearly with the same acceleration that it was actually moving with.
I did this by utilizing matrix transformations that only looked at the data between the four corners of the table. Now that the data was standardized, I created a simple tracking algorithm that looked for the differences between two consecutive frames and used those areas to isolate the puck's location.
With the program able to determine the puck's location at any point in time, I used a regression and modular arithmetic to determine the predicted final location of the puck. The biggest challenge surrounding building a robot to play air hockey is speed.
An average shot takes about 1.5 seconds to go from one end of the table to another.
That's why, when developing the tracking software and the prediction algorithm, I wanted it to be able to predict the puck's final location with as few as two datapoints.
In addition, I implemented an exponentially weighted moving average to account for tracking failures so that the program could correct for outliers and include long-term shifts in its predictions.
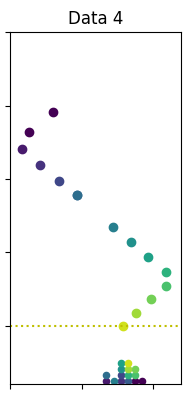
The plot presented is a visual depiction of the model's performance for the previous video.
The frames are first standardized and then the puck is detected and annotated onto the figure.
The different colors (ex. purple, yellow) are meant to indicate the time that puck was seen with ligher points being more recent and darker points being older.
The yellow horizontal line towards the bottom of the image is the y-axis at which the program is trying to predict the x position of puck.
Below that is a dotplot of the predictions of the puck's x coordinate for each point in time.
What this is able to depict, is that from the first point that the puck was detected to the last point untill it crossed the y-axis, it was able to predict, with reasonable accuracy it's final location!
And with this model, the plan is to get the robot to that positon and return the shot!